Topic
Financial Management Reporting - Financial Benefits & Outcomes Charts
Response
From time to time individual Teams will be required to demonstrate value for money (i.e. creating a return for the investment) and whether the overall efficiency of the Team is increasing, stable or in decline.
At the end of each Month the Agile Team should be creating a Financial Outcome & Benefits Chart to demonstrate working solutions is a primary measure of progress.
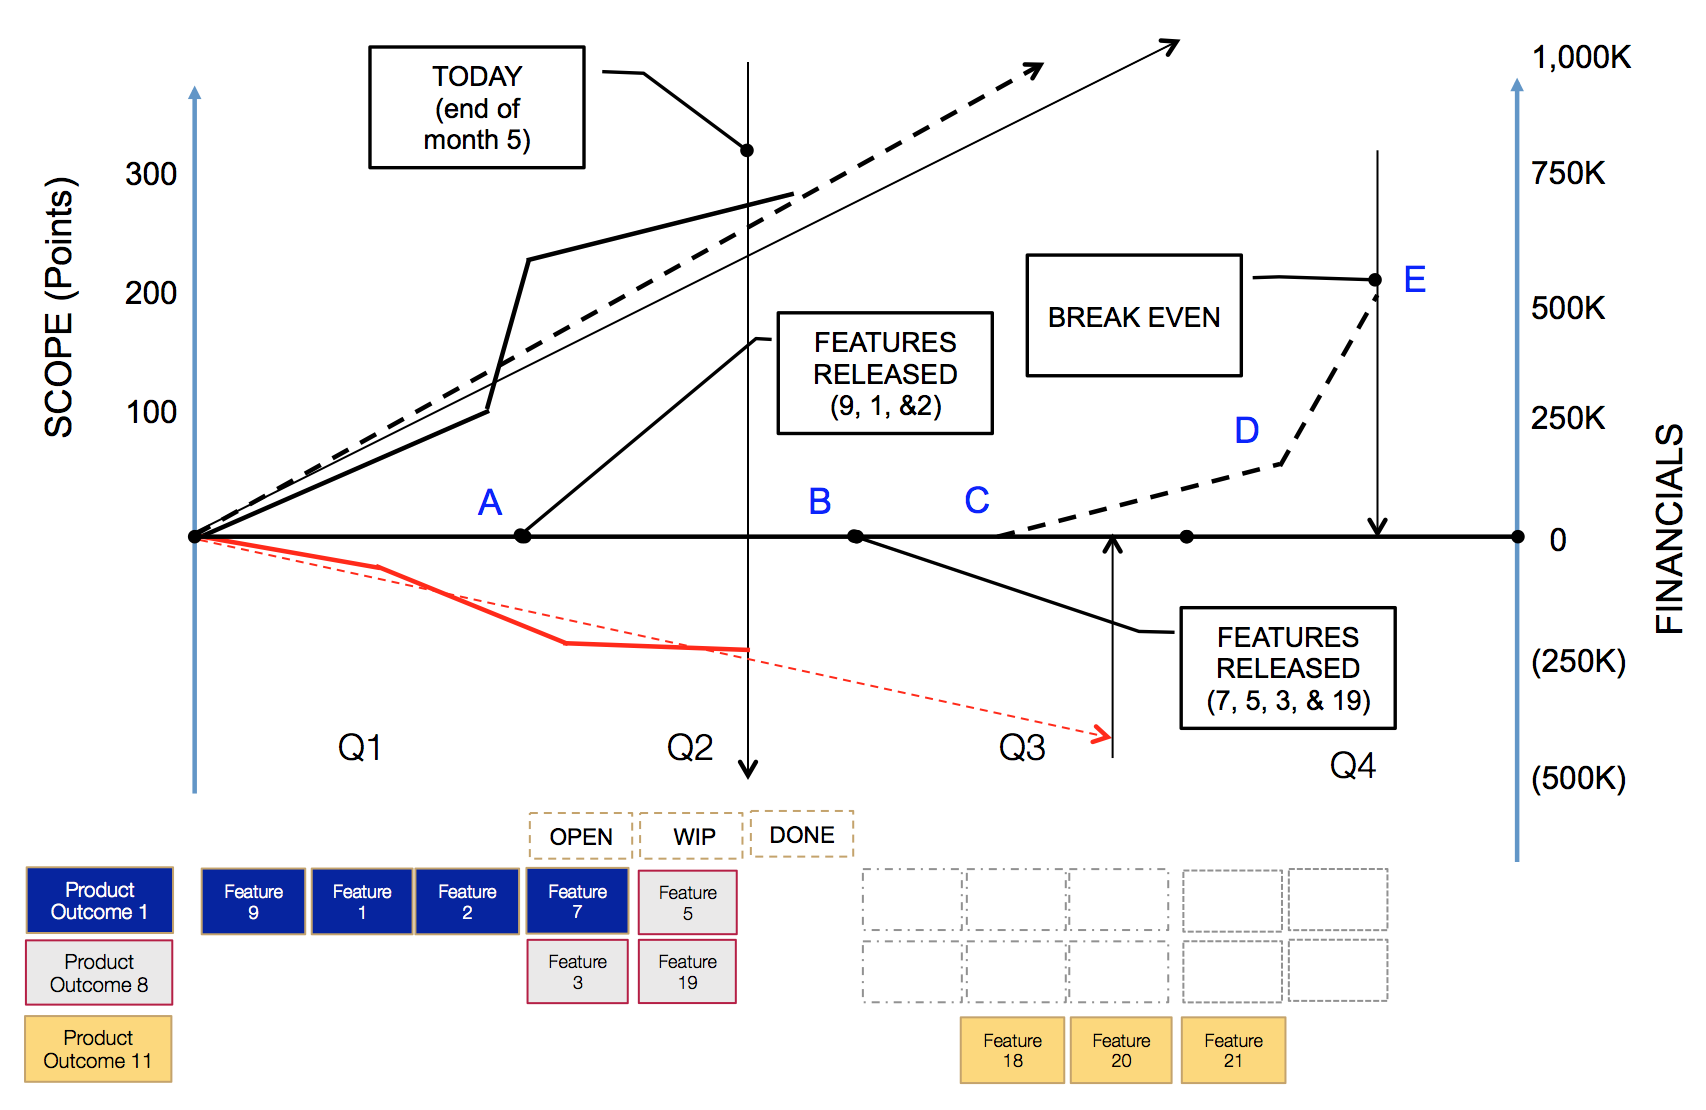
As the example below indicates, a Financial Outcome & Benefits Chart shows:
Features completed per Quarters (e.g. Feature 9, 1, & 2). Point A
Features planned for the current Quarter (e.g. Features 7, 3, 5, & 19) Point B
When the financial benefits from the first collection of Features will commence (indicated by the Feature 1 Release line. Point C
When the financial benefits from the second collection of Features will commence (indicated by the Feature 2 Release line. Point D
When the project break even occurs (i.e. when total cost (500K) is equal to total benefit (500K) Point E
The Effort (Points) are shown on the Y1 Axis
Forecast total cost (expense) for the project (red line) through to the end of Q3
The actual and forecasted scope complete burn up chart.
Discover more
Additional information on the creation of other financial management reports, including tempaltes are available in the Monetical knowledge base.
Contact us at info@monetical.com for further information and access.